Heuristics for Translating Ggplot2 Code to Plotnine Code

Dec 13, 2019 • 6 min read.
Because ggplot2 is the de-facto package for creating high-quality data visualizations in R, and has been for a long time, there exists many excellent resources for learning ggplot2, including:
- the ggplot2 website,
- a two-page cheat sheet (PDF),
- Stack Overflow, and
- books such as ggplot2: Elegant Graphics for Data Analysis and R Graphics Cookbook: Practical Recipes for Visualizing Data.

Two days ago, I published the tutorial Plotnine: Grammar of Graphics for Python, which is a translation of the visualization chapters from “R for Data Science” to Python using plotnine and pandas. plotnine code is bound to be different from ggplot2 code, due to Python and R having different syntax and mechanics. Moreover, since plotnine is still young (but actively being developed) some features are not yet implemented.
Does that mean we cannot make use of the above-mentioned resources? Of course not! First of all, the underlying grammar of graphics is still the same. Secondly, when it comes to the syntax, you can easily translate 95% of ggplot2 code to plotnine code if you take into account the heuristics listed below. But first, an example.
An example
This R and ggplot2 code:
library(ggplot2)

ggplot(mpg, aes(displ, hwy)) +
  geom_point(aes(colour = class)) +
  geom_smooth(se = FALSE, method = "lm") +
  guides(colour = guide_legend(override.aes = list(size = 4)))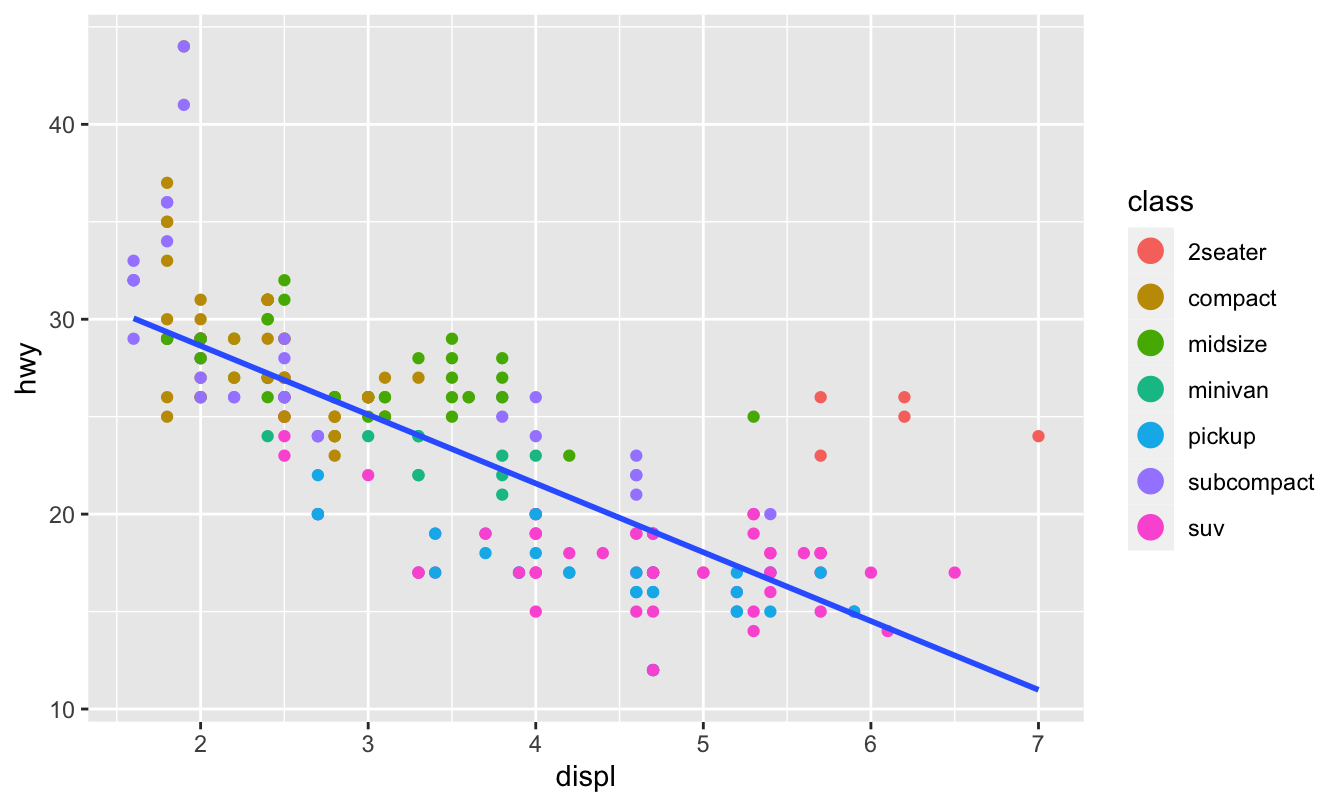
Can be translated into the following Python and plotnine code:
from plotnine import *
from plotnine.data import mpg

ggplot(mpg, aes("displ", "hwy")) +\
geom_point(aes(colour="class")) +\
geom_smooth(se=False, method="lm") +\
guides(colour=guide_legend(override_aes={"size": 4}))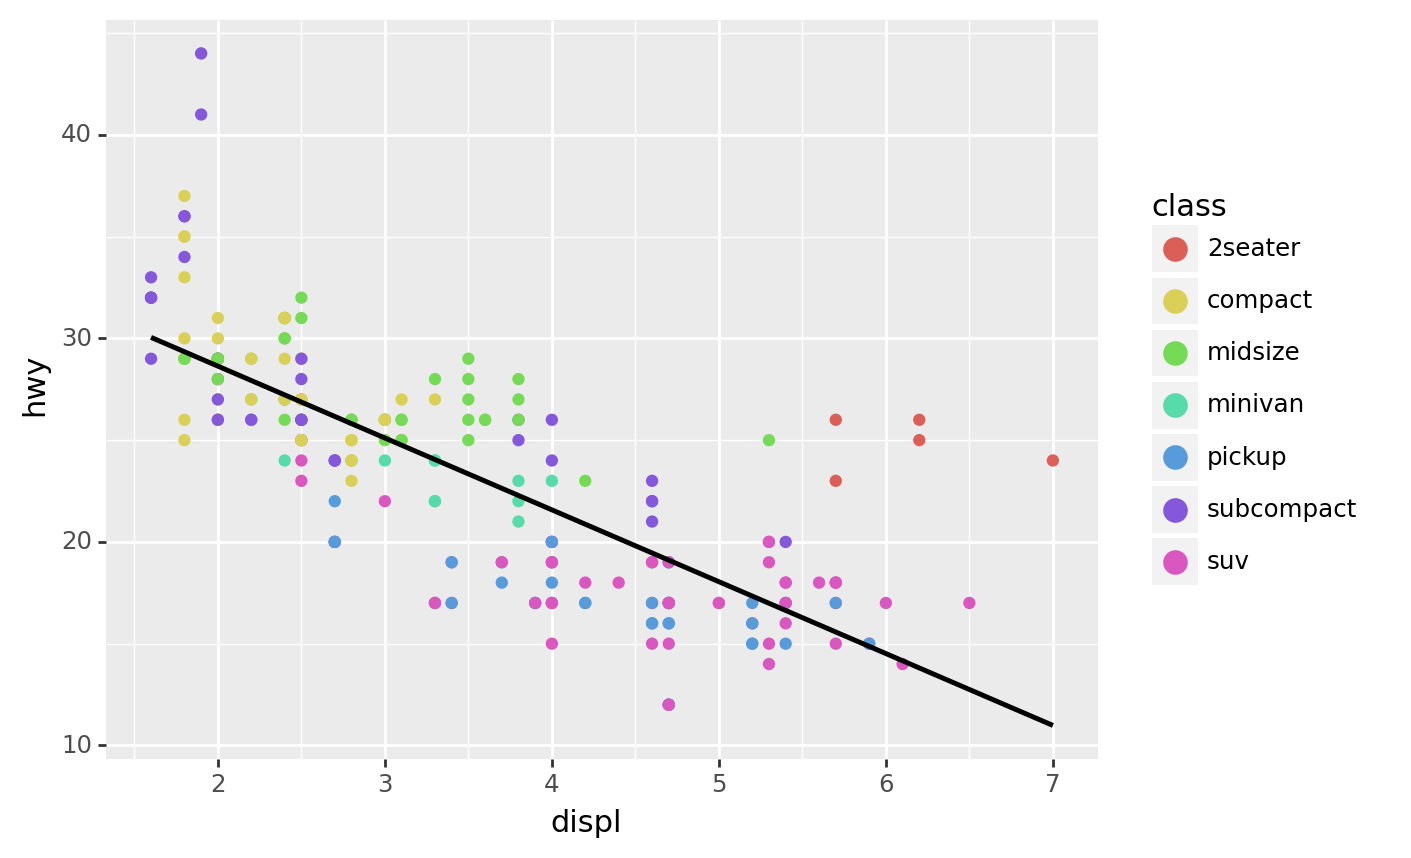
Simple replacements
- Change boolean values, i.e., replace
TRUEwithTrueandFALSEwithFalse. - Replace
NULLwithNone. - Quote all column names, e.g., replace
Specieswith"Species". Python unfortunately doesn’t have this thing called non-standard evaluation. - Remove spaces around equal signs, e.g., replace
mapping = aes(...)withmapping=aes(...). Style is important. - Replace the assignment operator, i.e.,
<-with=. - Replace dots with underscores, e.g., replace
show.legendwithshow_legend. In Python, names cannot contain dots. - Replace
hjustandvjustwithhaandva, respectively. This is inherited from matplotlib, which is used under the hood by plotnine. - If the code consists of multiple lines, add a continuation character,
i.e., replace
+with+\. Alternatively, wrap the entire expression in parentheses.
Miscellaneous
-
Quote inline expressions in its entirety, such as
"factor(col)"and"col < 5". -
Quote the facet specification in its entirety, such as
facet_wrap("~ class")andfacet_grid("drv ~ cyl"). -
To suppress labels you cannot use
labels=Nonebut you need to pass a list with as many empty strings as there are values. A helper function is useful here:def no_labels(values): return [""] * len(values) -
To prevent text labels from overlapping in ggplot2, you would use
geom_text_repelorgeom_label_repelfunctions from the ggrepel package. In plotnine, you simply usegeom_textorgeom_labeland specify theadjust_textargument. For example:geom_label(adjust_text={'expand_points': (1.5, 1.5), 'arrowprops': {'arrowstyle': '-'}}).
Features not yet implemented
- Unlike with ggplot2, in plotnine you cannot assign literal values to
your aesthetics; all values need to refer column names. For example,
aes(color="blue")results in an error ifblueis not a column in theDataFrame. - plotnine is currently missing the following functions:
coord_quickmap()andcoord_polar(). - The function
labs()does not support a subtitle or a caption.
Let me know if you think anything can be added to (or removed from!) this list of heuristics. Now go plot!
— Jeroen
Would you like to receive an email whenever I have a new blog post, organize an event, or have an important announcement to make? Sign up to my newsletter: