Bayesian A/B Testing Headlines

Aug 18, 2013 • 19 min read.
The Visual Revenue platform provides a number of great tools that support editors to optimize their front page. Instant Headline Testing is one of those tools. The quality of a story headline greatly influences its click-through-rate (CTR). Front page editors therefore spend a lot of thought coming up with the right wording to engage their readers. But on digital media, headlines do not have to be set in stone. Instant Headline Testing gives the editor the opportunity to improve the quality of a headline after it has made the front page. Let me give you an example.
A sporty example
With Super Bowl XLVII (and its power outage) still fresh in our minds, one of our clients, USA Today Sports, used our platform to conduct the following headline test:
Headline A: “What Harbaugh regrets about Super Bowl” (3.06% CTR)
Headline B: “John Harbaugh explains Super Bowl tirade” (4.93% CTR)
Headline A (the original headline) got 3.06% CTR and headline B got 4.93% CTR, which are both strong CTRs. After only seven minutes of testing the two headlines, headline B had been declared winner with 99.93% certainty (explained later). Subsequently, the winning headline was served to 100% of the audience for over one hour. Finally, the editor even made the change permanent in their CMS. Note that by changing a few words only, a 61% lift had been achieved, which eventually resulted in tens of thousands more views for that article!
Four challenges for instant headline testing
Instant Headline Testing is essentially A/B testing for story headlines. However, there are four challenges when it comes to Instant Headline Testing that we need to take into account.
- Headlines may be on the front page for only a couple of hours, so a headline test cannot take too long.
- The number of readers varies greatly per front page.
- The CTR of a headline depends on where it is positioned on the front page. For example, a headline positioned at the hero spot has a much higher CTR than one positioned at bottom.
- Front pages are dynamic, so headlines can change position.
Frequentist approach to instant headline testing
Our improved implementation overcomes these four challenges by using a Bayesian approach. Before I explain that, I’ll first discuss the frequentist approach to Instant Headline Testing.
To conclude which headline is better than the other, we cannot just look at the highest CTR. We need to apply statistics in order make sure that the difference in CTR did not happen by chance. It may be the case that we cannot declare a headline as winner at all.
We apply statistics to the data that we have collected during the headline test. This data includes front page impressions (i.e., views) and clicks. The more data the better, right? Well, not quite. It’s important to realize is that the longer a headline test is running, the longer we are serving one headline of possibly lesser quality to 50% of the readers. This means that the corresponding article may lose out on value. In decision theory, the difference between the actual and potential article impressions is known as regret.
So, on the one hand, we want to collect as much data as possible in order to make a reliable conclusion, while on the other hand, we want to maximize article impressions, i.e., minimize regret. This raises two questions: (1) When can we stop a headline test? and (2) How do we know that one headline is better than the other?
Within statistics, the frequentist approach and the Bayesian approach are two well-known approaches when it comes to A/B testing. The frequentist approach provides a statistical test whether the CTRs of the two headlines are significantly different. That would answer our second question.
The frequentist approach doesn’t provide an easy answer to the first question because the statistical test assumes that the number of views are fixed before we start a headline test. Furthermore, we cannot run a headline test until we see a significant difference between CTRs as this would falsely increase the probability of obtaining a significant result, as Evan Miller explains on his blog. We would have to estimate how many views we would need in order to obtain a significant difference.
And this is where the four challenges come into play. Due to challenge 1, the headline test cannot take too long, say 20 minutes at most, which limits the number of views we can get. Because of challenge 2, the views per minute may be anything between 10 and 10,000, and we do need to have a tool that’s usable by all our front page editors. Challenge 3 determines the CTRs of the headlines as well. When the CTRs are closer together, we need more views in order to obtain a statistically significant difference. Including these three challenges when estimating the desired number of views is not straightforward. On top of that, when a headline changes position during a test (which is the fourth challenge), our estimate becomes completely invalid!
Let’s have a look at a Bayesian approach to Instant Headline Testing, which is one that I find much more straightforward and elegant.
Bayesian approach to instant headline testing
Whereas the frequentist approach assumes that the “true” CTRs remain the same, all that the Bayesian approach cares about is the data we have actually observed. So, we don’t need to worry about estimating the required number of views beforehand. Moreover, the Bayesian approach doesn’t mind that headlines change position while testing, so that overcomes challenge 4.
Below I’ll first explain how the Bayesian approach determines when to stop a headline test (which was our first question). The second question, determining whether one headline is better than the other is discussed in the next section.
During the headline test we keep track of number of views and number of clicks on headline A and B. Important here is the absolute difference between the number of clicks both headlines. When the absolute difference crosses the so-called Anscombe boundary, we stop the headline test.
The Anscombe boundary is defined in terms of (1) the number of views so far, (denoted by $n$) and (2) the number of views we will be serving the winning headline (denoted by $k$). Stated more formally, we stop when the following inequality is true:
$$ |y| \gt -\Phi^{-1}\left(\frac{n}{k + 2n}\right) \sqrt{n} $$
where $y$ is the absolute difference between the number of clicks for both headlines. The shape of the Anscombe boundary is shown in the figure below. Here, we assumed that the front page gets 1,000 views per minute (VPM). So, after 20 minutes of testing, the front page has been viewed 20,000 times. The figure also shows the absolute difference for five simulated headline tests (CTR A=5%, CTR B=3%), which are denoted by gray lines.
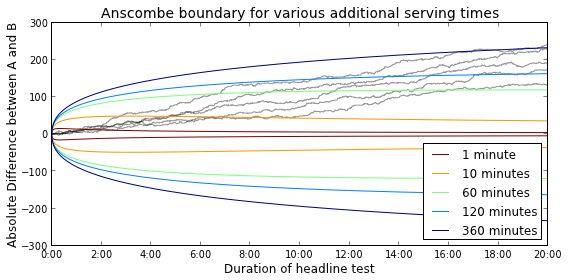
The figure illustrates that the Anscombe boundary takes the trade-off between the number of views so far, and the number of views after conclusion into account. In a recent blog post, Aaron Goodman performed an interesting comparison between the frequentist, multiple testing, and Bayesian approaches. He demonstrated that the Bayesian approach is best at minimizing regret, or, in other words, maximizing article views.
Again, once the absolute difference passes the Anscombe boundary, we are ready to conclude which headline was better.
Certainty of conclusion
It would nice to know with how much certainty we can conclude that one headline is better than the other.
The certainty associated with the CTRs of Headlines A and B can be modeled by a beta distribution. The beta distribution can be defined in terms of the number of views and CTR as follows:
$$ \beta\left(\textrm{views} \times \textrm{CTR}, \textrm{views} \times \left(1-\textrm{CTR}\right)\right) $$
The figure below shows how a beta distribution becomes more peaked as the number of views increases (while keeping the CTR at 20%). It illustrates that as we collect more evidence (i.e., views) our uncertainty about the CTR decreases.
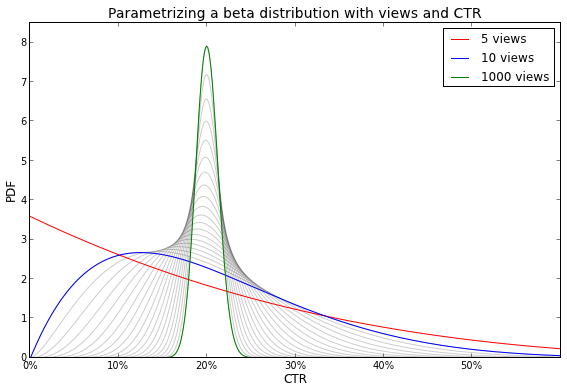
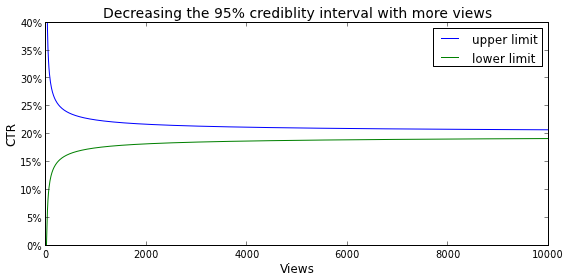
The gray lines may give the impression that the peakedness increases linearly with the number of views, but please note that these lines represent the number of views on a log scale. Allow me to clarify this with the following image, which shows that the interval in which 95% of the probability density is located, i.e., the 95% credibility interval as it is called in Bayesian statistics, decreases exponentially with respect to the number of views.
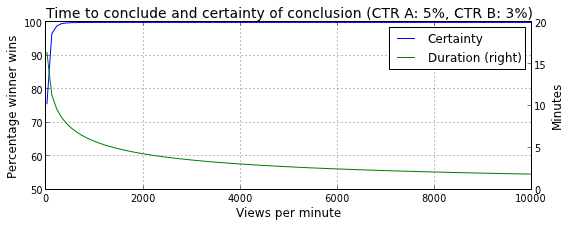
The amount of overlap between A’s beta distributions and B’s beta distribution determines the certainty of our conclusion. We can estimate this certainty by generating a random value (i.e., drawing a random sample) from both beta distributions and note which value one is higher. If we repeat this, say, a million times, we can accurately estimate the probability that B is better than A. This probability is the certainty with which we can declare headline B as the true winner.[1]
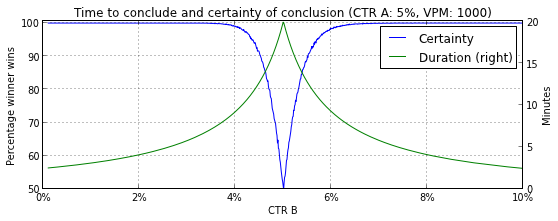
Below are two figures that show how long it takes to conclude and the amount of certainty associated to that conclusion. In the first figure, the CTRs of both headlines are kept constant (CTR A=5%, CTR B=3%), and the views per minute (VPM) varies from 10 to 10,000. In the second figure, the VPM (=1000) and the CTR of headline A (=5%) are kept constant and the CTR of headline B varies from 0% to 10%.
In case of sufficient certainty, we declare the headline with the highest CTR as the winner of the headline test. After that, the editor may decide to continue to serve the winning headline to 100% of the readers.
The serving aspect is actually taken care of by our platform and doesn’t require any additional integration, but that’s material for a blog post that one of our fine front-end engineers should write!
Conclusions
Visual Revenue’s Instant Headline Testing tool enables editors to A/B test easily different headlines and to quickly see whether the quality has improved. The frequentist approach, which is often used for A/B tests, is unable to overcome the challenges that are associated with A/B testing headlines. The Bayesian approach, however, offers the flexibility that front pages require.
I have explained how the Bayesian approach, using the Anscombe boundary, determines when the stop a headline test. I also discussed how we can compute the certainty associated with concluding that one headline is better than the other.
If you would like to play with beta distributions and compute the associated certainty, Peak Conversion provides a nice graphical calculator.
If I still haven’t convinced you that the Bayesian approach is the way to go, then you may want to have a look at: “So you want to run an experiment, now what? Some Simple Rules of Thumb for Optimal Experimental Design.” by John List, Sally Sadoff, and Mathis Wagner.
Alternatively, the frequentist approach provides methods that allow for setting up “checkpoints” where you may determine whether you want to stop a headline test. In other words, these methods offer correction for multiple testing.
– Jeroen
Instead of estimating the certainty, it can also be computed in closed form (see this post from John Cook’s blog), but the stats.beta.pdf function from scipy doesn’t like very peaked beta distributions. ↩︎
Would you like to receive an email whenever I have a new blog post, organize an event, or have an important announcement to make? Sign up to my newsletter: